Area-based Rao's index.
Matteo Marcantonio
2023-05-10
Source:vignettes/rasterdiv_area_based_Rao.Rmd
rasterdiv_area_based_Rao.RmdThis vignette uses rasterdiv to derive classic and multidimension area-based Rao’s index from an input vector layer and multiple raster layers.
Overview
A RasterLayer called copNDVI is loaded together with the package
rasterdiv. copNDVI is a 8-bit raster, meaning
that pixel values range from 0 to 255. You could stretch it to
match a more familiar (-1,1) values range using
raster::stretch(copNDVI,minv=-1,maxv=1) .
Reclassify NDVI
Pixels with values 253, 254 and 255 (water) will be set as NA’s.
copNDVI <- raster::reclassify(copNDVI, cbind(252,255, NA), right=TRUE)Resample NDVI to a coarser resolution
To speed up the calculation, the RasterLayer will be “resampled” at a resolution 10 times coarser than original and cut on Africa.
#Resample using raster::aggregate and a linear factor of 10
copNDVIlr <- raster::aggregate(copNDVI, fact=10)
#Set float numbers as integers to further speed up the calculation
storage.mode(copNDVIlr[]) = "integer"
Compute Area based Rao’s Index
#Plot classic area-based Rao's index
plot(RaoC, col=hcl(RaoC$alpha.1*10), main="Classic Rao's index per continent alpha 1")
text(RaoC, label=paste("Rao'Q =", round(RaoC$alpha.1,1)), col="black", family="Arial", halo=TRUE)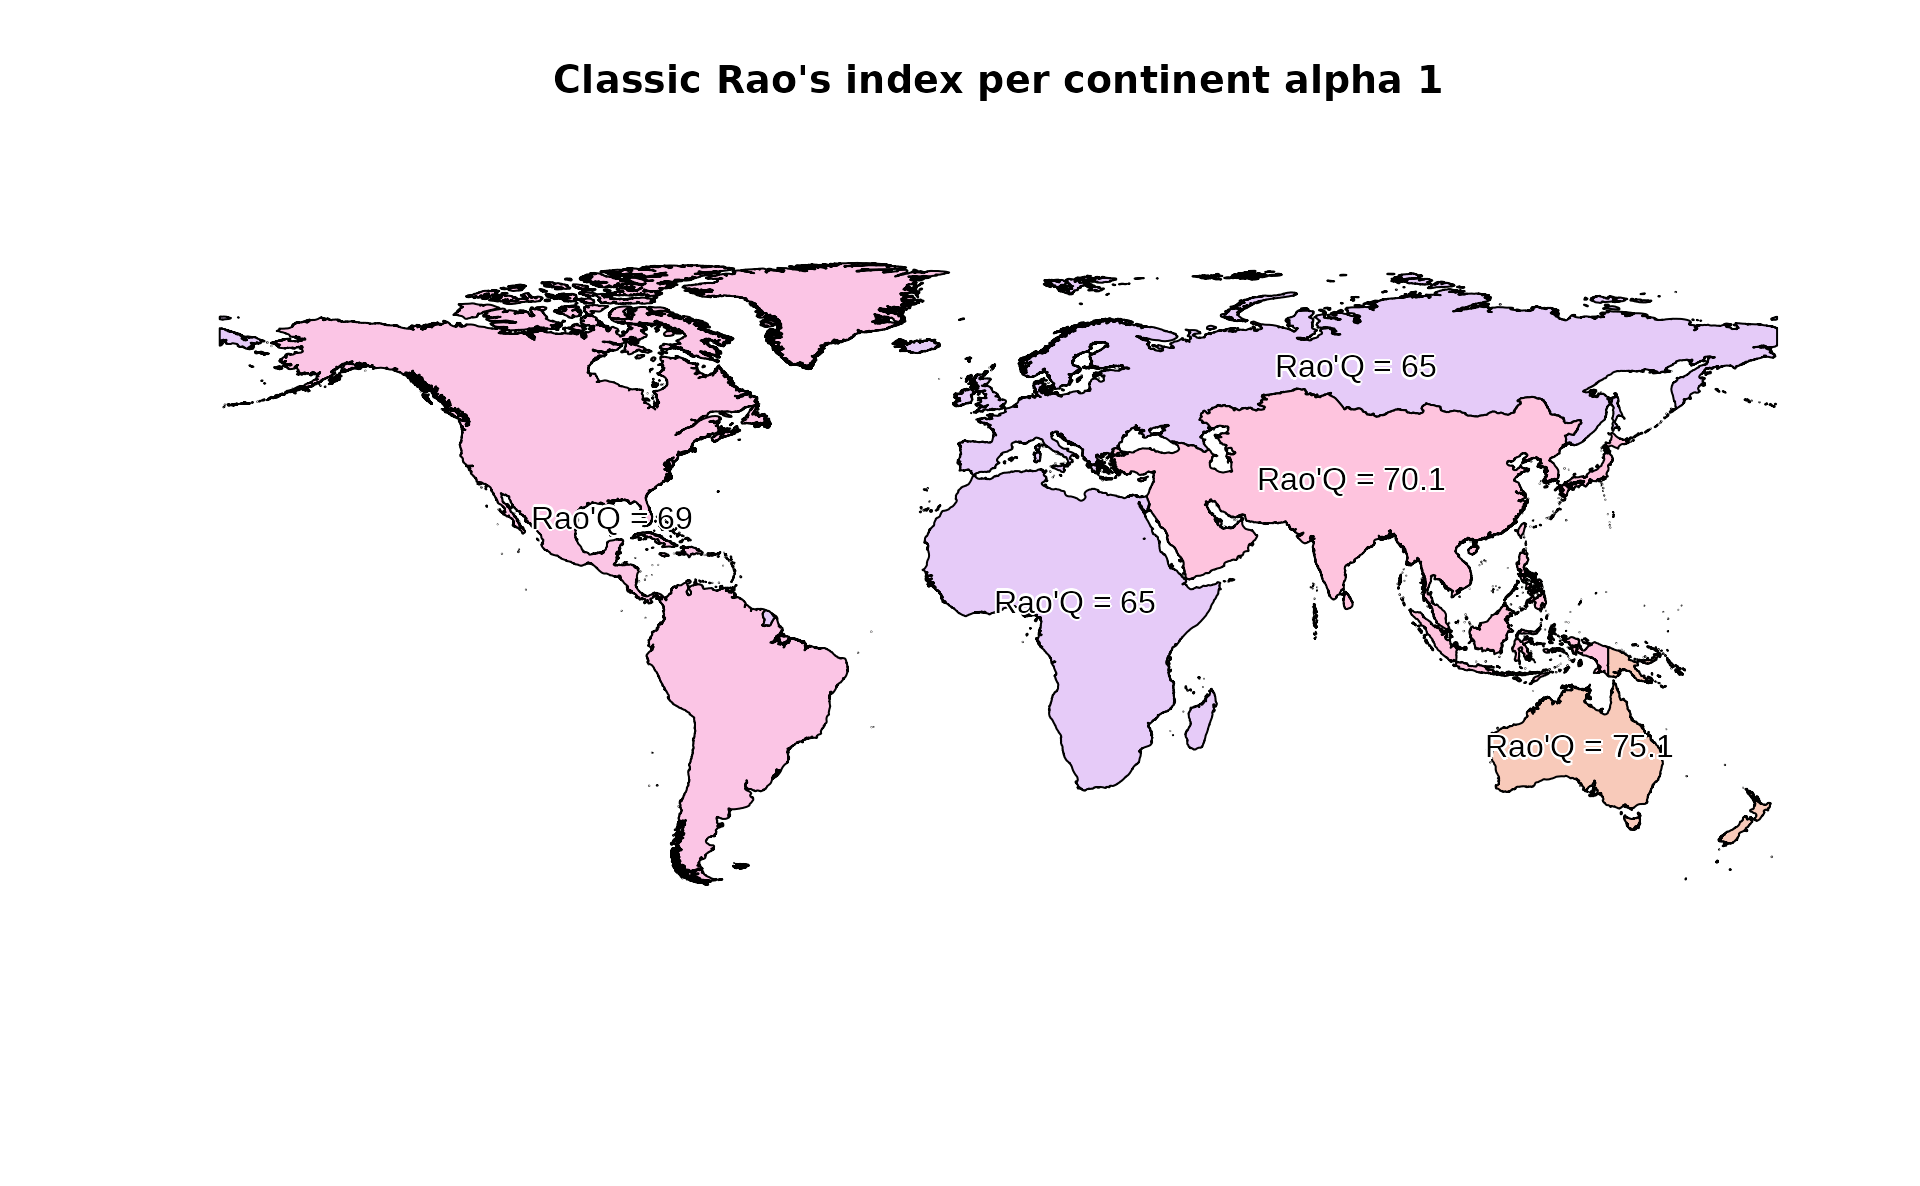
Compute multidimension area-based Rao’s Index
# The second layers is NDVI/100 (just as an example)
RaoMC <- paRao(x=stack(copNDVIlr,copNDVIlr/2), area=world, field='CONTINENT', alpha=5, method="multidimension", simplify=1)
#Plot area-based RAo's index
plot(RaoMC, col=hcl(RaoMC$alpha.5*10000), main="Multidimension Rao's index per continent alpha 5")
text(RaoMC, label=paste("Rao'Q =", round(RaoMC$alpha.5,3)), col="black", family="Arial", halo=TRUE)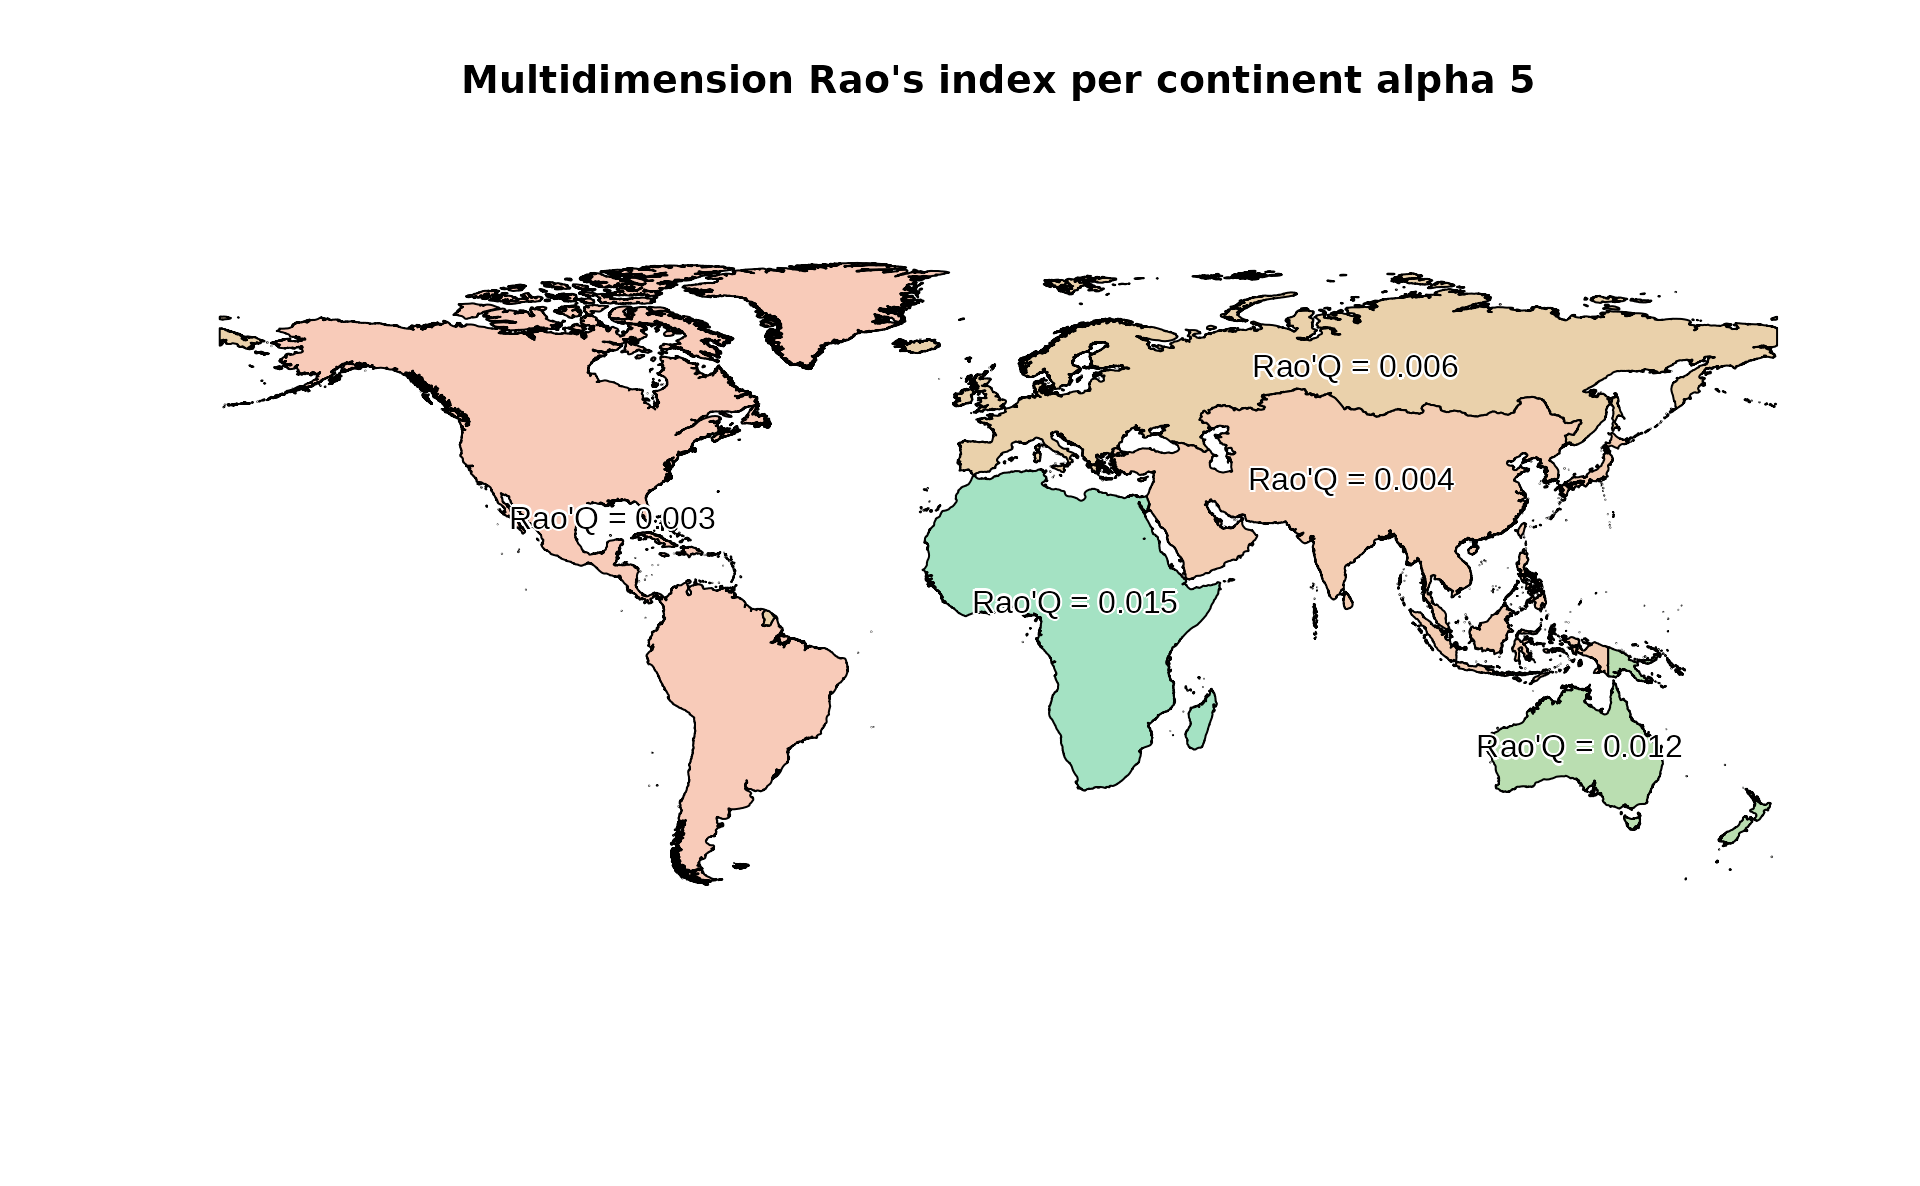
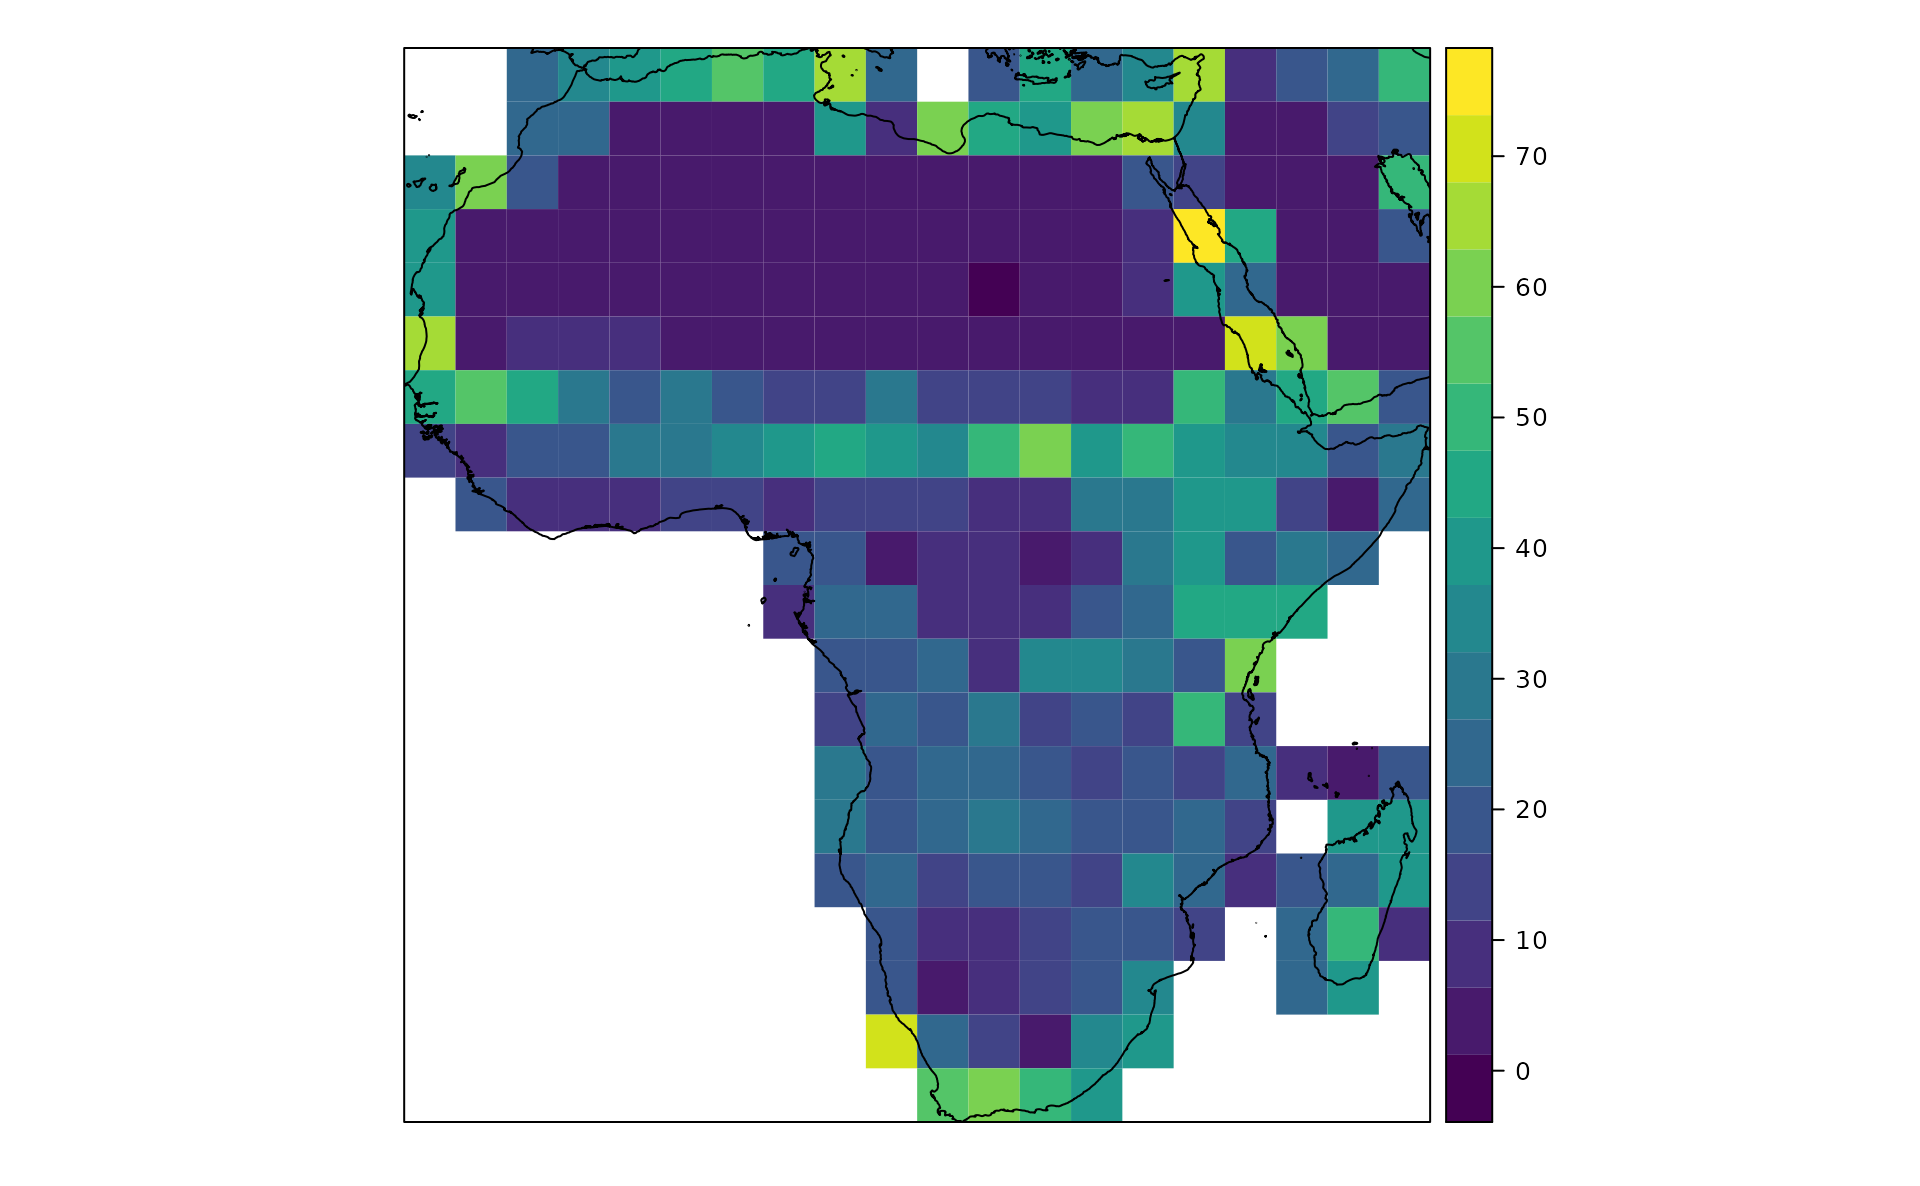
Additional example subsetting on a continent and then using a grid vector to derive Rao’s in each cell
#Subset
africa <- subset(world, CONTINENT=="Africa")

#Make the raster grid
africa.r <- raster(extent(africa), nrow=20, ncol=20, crs = "+proj=longlat +datum=WGS84 +no_defs +ellps=WGS84 +towgs84=0,0,0")
africa.r[] <- 1:ncell(africa.r)

#Transform it in a vector
africa.v = as(africa.r, "SpatialPolygonsDataFrame")

#Derive Rao's (alpha=2) for each grid cell
RaoGRID <- paRao(x=copNDVIlr, area=africa.v, field='layer', alpha=2, simplify=1, na.tolerance=0.5)

#Transform the spatial polygon data frame in a raster layer that can be used in levelplot
rr <- raster(RaoGRID,ncol=20, nrow=20)
values(rr) <- RaoGRID$alpha.2
#Plot Rao's per grid cell
levelplot(rr,col.regions=viridis_pal(option = "D"),margin=FALSE,scales=list(draw=FALSE),xlab=NULL,ylab=NULL) +
layer(sp.polygons(world,col="black"))